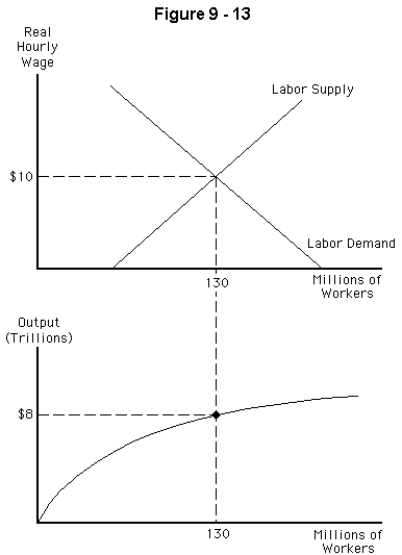
-Refer to Figure 9-13.An increased labor supply on the graph would
A) decrease total output
B) increase total output at a constant rate
C) increase total output at an increasing rate
D) increase total output at a decreasing rate
E) not change total output
Correct Answer:
Verified
Q135: Q136: Which organization has the goal of helping Q137: Which of the following is not among Q138: When using real GDP per capita to Q139: The characteristics that create a vicious cycle Q141: Budget deficits cause interest rates to be Q142: The total stock of capital will always Q143: The formula for labor productivity is given Q144: Over the past thirty years in the Q145: Which of the following would cause the![]()
Unlock this Answer For Free Now!
View this answer and more for free by performing one of the following actions

Scan the QR code to install the App and get 2 free unlocks

Unlock quizzes for free by uploading documents