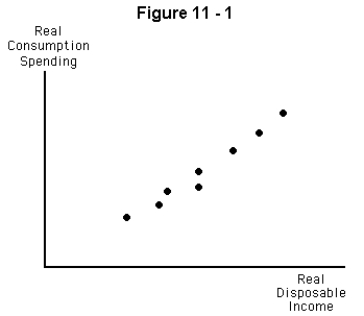
-Refer to Figure 11-1.The graph shows
A) a negative and relatively stable relationship between real consumption and real disposable income
B) a negative,but unstable,relationship between real consumption and real disposable income
C) a positive,but unstable,relationship between real consumption and real disposable income
D) a positive and relatively stable relationship between real consumption and real disposable income
E) no discernible relationship between real consumption and real disposable income
Correct Answer:
Verified
Q27: If the marginal propensity to consume is
Q28: Use the table below to determine autonomous
Q29: Which of the following is a definition
Q30: Which of the following would not increase
Q31: Use the table below to determine the
Q33: Which of the following is the definition
Q34: Use the table below to determine the
Q35: Which of the following would lead to
Unlock this Answer For Free Now!
View this answer and more for free by performing one of the following actions

Scan the QR code to install the App and get 2 free unlocks

Unlock quizzes for free by uploading documents