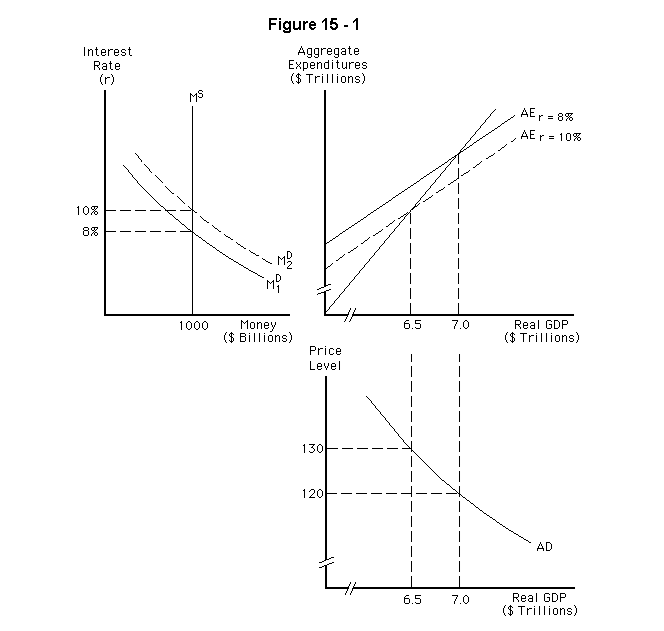
-Refer to Figure 15-1.Assume the economy is in equilibrium at $7 trillion.If the changes in all three graphs were caused by the same event,what was that event?
A) An increase in nominal income
B) An increase in the price level
C) An increase in the interest rate
D) An increase in taxes
E) An increase in real income.
Correct Answer:
Verified
Q1: Due to the multiplier effect,a decrease in
Q2: The aggregate demand curve
A) is a horizontal
Q4: In the aggregate demand-aggregate supply model,an increase
Q5: A decrease in the price level will
Q6: Equilibrium real GDP is
A) independent of the
Q7: Which of the following would lead to
Q8: The aggregate demand curve tells us the
Q9: The aggregate demand curve
A) represents the relationship
Q10: Which of the following would lead to
Q11: An increase in the price level will
Unlock this Answer For Free Now!
View this answer and more for free by performing one of the following actions

Scan the QR code to install the App and get 2 free unlocks

Unlock quizzes for free by uploading documents