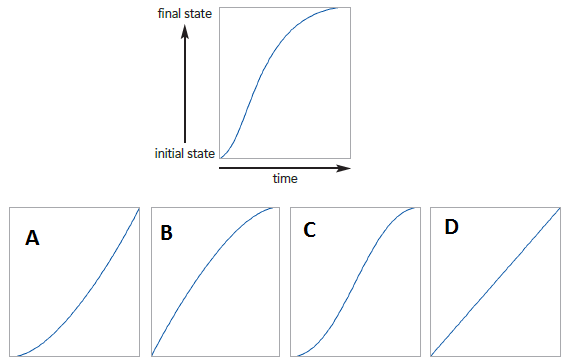
 In the accompanying figure of graphing the transition timings, the vertical axis measures the progress of the transition toward completion and the horizontal axis measures the duration. Which of the following graphs labelled A, B, C, and D represents the ease-in-out timing?
A) A
B) D
C) B
D) C
Correct Answer:
Verified
Q41: _ is an HTML5 audio and video
Q44: The styles for the _ pseudo-element are
Q49: Which of the following is true of
Q50: For longer video clips,the time in the
Q50: Q53: Which of the following Flash player parameters Q56: The value of the kind attribute that Q58: Identify the kind attribute that is a Q58: Which of the following structures is the Q59: ![]()
![]()
Unlock this Answer For Free Now!
View this answer and more for free by performing one of the following actions

Scan the QR code to install the App and get 2 free unlocks

Unlock quizzes for free by uploading documents