The following graph shows the actual percentage of U.S. households with a computer as a function of household income (the data points) and a logistic model of these data (the curve) . The logistic model is 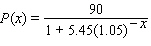 where
where  is the household income in thousands of dollars. For low incomes, the logistic model is approximately exponential. Which exponential model best approximates
  for small
  ? Round the coefficients to the nearest hundredth.
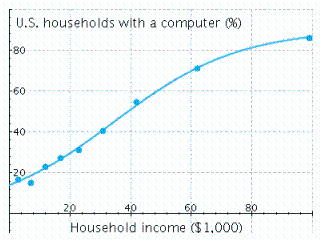
A) 
B) 
C) 
D) 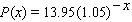
E) 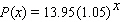
Correct Answer:
Verified
Q70: The chart shows the number of research
Q71: The table below is filled correctly. Exponential
Q72: Choose the logistic function that best approximates
Q73: How long, to the nearest year, will
Q74: The table below is filled correctly. Exponential
Q76: Find the logistic function Q77: The graph shows the actual percentage of Q78: Choose the logistic function that best approximates Q79: Convert the exponential function to the form Q80: Find the logistic function ![]()
![]()
Unlock this Answer For Free Now!
View this answer and more for free by performing one of the following actions

Scan the QR code to install the App and get 2 free unlocks

Unlock quizzes for free by uploading documents