Multiple Choice
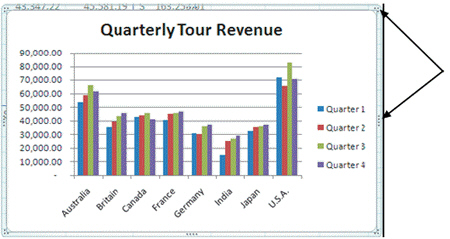 The chart shown in the figure above is a(n) ____ chart.
A) clustered column
B) exploding pie
C) scatter
D) line
Correct Answer:
Verified
Related Questions
The chart shown in the figure above is a(n) ____ chart.
A) clustered column
B) exploding pie
C) scatter
D) line
Correct Answer:
Verified

