Multiple Choice
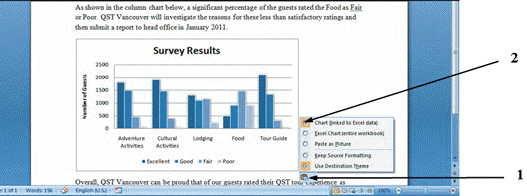 The chart shown in the figure above will reflect ____ updates made to the source chart in Excel.
A) color
B) font size
C) data
D) font type
Correct Answer:
Verified
Related Questions
Q1: If a text value in a Word
Q6: When you integrate data from multiple Office
Q21: Office technology allows you to _, or
Q22: After you create an object in one
Q23: You can "collect" up to _ items
Q24: You use the term linked object to
Unlock this Answer For Free Now!
View this answer and more for free by performing one of the following actions

Scan the QR code to install the App and get 2 free unlocks

Unlock quizzes for free by uploading documents