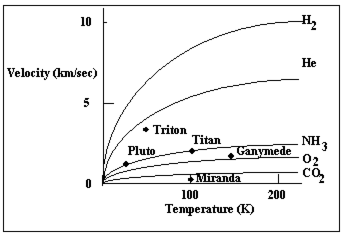
The graph below plots the escape velocity of several solar system objects along the vertical axis and the surface temperature along the horizontal axis. The lines plotted in the figure are the speeds of the fastest gas particles as a function of temperature for various gases. Which of the objects in this diagram has the greatest surface temperature? 
A) Ganymede
B) Pluto
C) Titan
D) Triton
E) Miranda
Correct Answer:
Verified
Q21: Which of these wins the prize as
Q25: Saturn's rings are
A)composed of ice particles.
B)in the
Q26: We can be sure the particles in
Q29: The narrowness of the rings of Uranus
Q30: _ is a satellite of Pluto.
A)Miranda
B)Charon
C)Venus
D)Krypton
E)Nereid
Q31: The rotation of Uranus is peculiar in
Q34: Saturn's atmosphere
A)has more distinctive zones and belts
Q37: The magnetic fields of Uranus and Neptune
Unlock this Answer For Free Now!
View this answer and more for free by performing one of the following actions

Scan the QR code to install the App and get 2 free unlocks

Unlock quizzes for free by uploading documents