Multiple Choice
Which of the following illustrations represents a circle graph?
A) 
B) 
C) 
D) 
E) 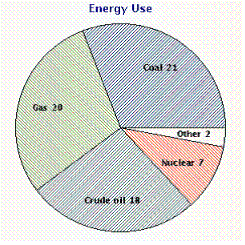
Correct Answer:
Verified
Related Questions
Q16: What number is 75% of 400?
A) 309
B)
Q17: Change the following percent to a
Q18: What number is 17% of 90?
Q19: What number is 14% of 150 ?
A)
Q20: Change 0.001 to a percent.
A) 10%
B) 0.0001%
C)
Q22: What percent of 100 is 71 ?
A) 710%
B)
Q23: The cost to repair a car after
Q24: Refer to the pie graph that shows
Q25: Find the number of gallons of sulfuric
Q26: What percent of 4,000 is 2,200 ?
A) 55%
B)
Unlock this Answer For Free Now!
View this answer and more for free by performing one of the following actions

Scan the QR code to install the App and get 2 free unlocks

Unlock quizzes for free by uploading documents