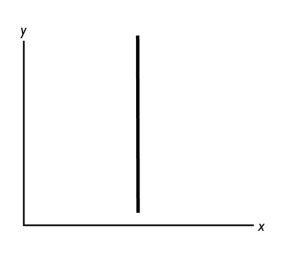
-In the above figure,as the y variable increases,
A) the x variable is constant.
B) the x variable increases.
C) the x variable decreases.
D) the x variable at first increases but then decreases.
E) the x variable probably changes, but more information is needed to determine if it increases, decreases, or stays the same.
Correct Answer:
Verified
Q178: If there is a positive relationship between
Q179: To show the values of an economic
Q180: A graph that shows how the amount
Q181: Q182: Consider a diagram in which the variable Q184: "As the price of gasoline increases,fewer people Q185: Matt pays a $50 a month membership![]()
Unlock this Answer For Free Now!
View this answer and more for free by performing one of the following actions

Scan the QR code to install the App and get 2 free unlocks

Unlock quizzes for free by uploading documents