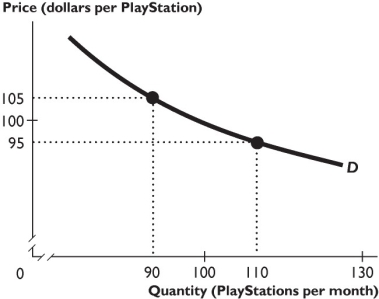
-The demand curve shown in the figure above is ________ over the price range from $95 to $105 per unit.
A) perfectly elastic
B) perfectly inelastic
C) unit elastic
D) elastic but not perfectly elastic
E) inelastic but not perfectly inelastic
Correct Answer:
Verified
Q242: When income increases from $20,000 to $30,000
Q244: When income increases by 6 percent,the demand
Q245: The income elasticity of demand for used
Q246: The measure used to determine whether two
Q248: Which of the following is most likely
Q249: The lower the level of income in
Q250: When the price of a pizza is
Q251: The income elasticity of demand is the
Q252: When income increases from $30,000 a year
Q259: ![]()
Unlock this Answer For Free Now!
View this answer and more for free by performing one of the following actions

Scan the QR code to install the App and get 2 free unlocks

Unlock quizzes for free by uploading documents