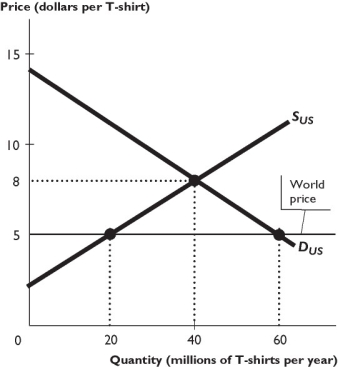
The figure above shows the U.S. market for T-shirts, where SUS is the domestic supply curve and DUS is the domestic demand curve. The United States trades freely with the rest of the world. The world price of a T-shirt is $5.
-Based on the figure above,as a result of international trade,U.S.domestic production ________ million T-shirts per year.
A) decreases by 20
B) increases by 20
C) decreases by 10
D) increases by 40
E) increases by 10
Correct Answer:
Verified
Q213: When the United States imports goods from
Q214: The United States
A) needs tariffs to allow
Q215: A major reason why it is difficult
Q216: Trade is often restricted because the
A) total
Q217: The national security argument is used by
Q219: Comparing developed and developing nations in their
Q220: The _ are hurt by importing a
Unlock this Answer For Free Now!
View this answer and more for free by performing one of the following actions

Scan the QR code to install the App and get 2 free unlocks

Unlock quizzes for free by uploading documents