Multiple Choice
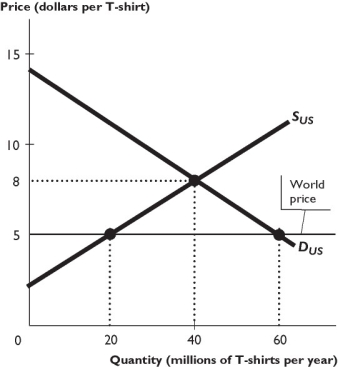
The figure above shows the U.S. market for T-shirts, where SUS is the domestic supply curve and DUS is the domestic demand curve. The United States trades freely with the rest of the world. The world price of a T-shirt is $5.
-Based on the figure above,international trade leads to
A) a net gain of surplus of $60 million.
B) a net loss of surplus of $60 million.
C) a net gain of surplus of $90 million.
D) a net loss of surplus of $90 million.
E) no net gain or loss of surplus.
Correct Answer:
Verified
Related Questions

