Use the data in the table to make a line graph showing the average acreage (in acres) of U.S. farms for the years 1950 through 1990.
A) 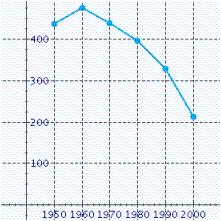
B) 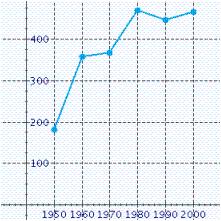
C) 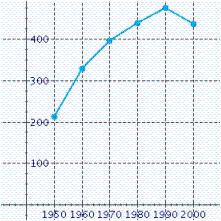
D) 
E) 
Correct Answer:
Verified
Q2: If the symbol Q5: Which of the following illustrations is a Q6: Raul has an adjusted income of $153,850, Q8: Use the data in the table Q9: Which of the following illustrations is a Q10: Refer to the pie graph that shows Q11: Which of the following illustrations is a Q12: Which of the following illustrations best represents Q20: How many more pet cats are there Q27: Find the mean of the list of![]()
Unlock this Answer For Free Now!
View this answer and more for free by performing one of the following actions

Scan the QR code to install the App and get 2 free unlocks

Unlock quizzes for free by uploading documents