A sporting goods manufacturer makes baseballs. The target mass of a baseball is 145.5 grams with a standard deviation of ±3.5 grams. A technician selects 100 baseballs at random per hour and records the mean mass of the samples. The table below lists the mass in grams for a 36 hour period.
Determine the most accurate mean control chart drawn from the data shown in the table.
A) 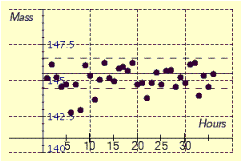
B) 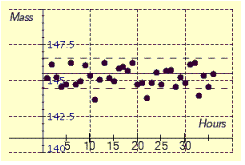
C) 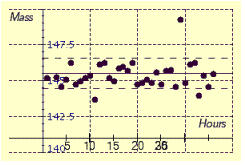
D) 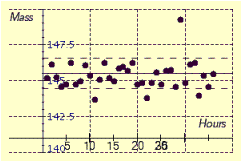
Correct Answer:
Verified
Q181: Consider the following bar graph. What country
Q182: Find the sample standard deviation from
Q183: Find the sample standard deviation from
Q184: The depth of a silicon wafer
Q185: Find the sample standard deviation from
Q187: Find the sample standard deviation from
Q188: The illumination of a light bulb is
Q189: Find the sample standard deviation from
Q190: Find the sample standard deviation from
Q191: Find the sample standard deviation from
Unlock this Answer For Free Now!
View this answer and more for free by performing one of the following actions

Scan the QR code to install the App and get 2 free unlocks

Unlock quizzes for free by uploading documents