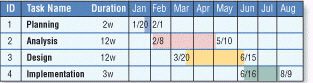
 Figure 12-4 As shown in Figure 12-4, a Gantt chart, developed by Henry Gantt, is a ____.
A) diagram that graphically shows how actors interact with an information system
B) tool that graphically shows the flow of data in a system
C) bar chart that uses horizontal bars to show project phases or activities
D) table that lists a variety of conditions and the actions that correspond to them
Correct Answer:
Verified
Q1: Tools that a systems analyst uses for
Q2: In sequence, most system development cycles contain
Q4: System development should follow all of these
Q5: _ measures whether the lifetime benefits of
Q6: The _ is the most important data
Q7: _ measures how well a proposed system
Q8: On a data flow diagram, a _
Q9: A(n) _ is any tangible item such
Q10: _ helps system developers to understand exactly
Q11: The _ for a project begins when
Unlock this Answer For Free Now!
View this answer and more for free by performing one of the following actions

Scan the QR code to install the App and get 2 free unlocks

Unlock quizzes for free by uploading documents