Multiple Choice
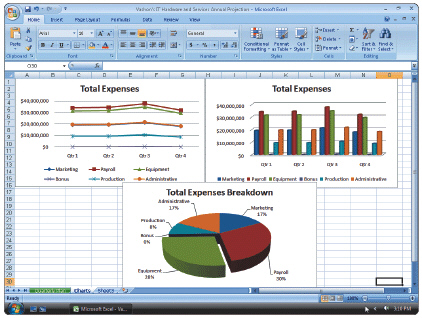 Figure 3-1 A ____, such as that in Figure 3-1, shows a trend during a period of time, as indicated by a rising or falling line.
A) column chart
B) line chart
C) pie chart
D) scatter chart
Correct Answer:
Verified
Related Questions
Q34: When computer users _ a document, they
Q35: Two of the more commonly used _
Q36: _ is ideal for the production of
Q37: When computer users _ a document, the
Unlock this Answer For Free Now!
View this answer and more for free by performing one of the following actions

Scan the QR code to install the App and get 2 free unlocks

Unlock quizzes for free by uploading documents