Multiple Choice
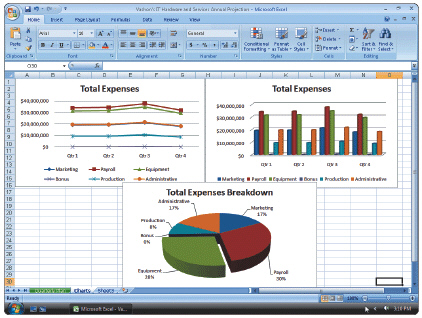 Figure 3-1 A ____, such as that in Figure 3-1, displays bars of various lengths to show the relationship of data.
A) column chart
B) line chart
C) pie chart
D) scatter chart
Correct Answer:
Verified
Related Questions
Q23: Most PDAs and many smart phones today
Q24: On a Tablet PC, the primary input
Q25: To cut involves removing a portion of
Q26: When computer users _ a document, the
Q27: Using the _ =SUM(B10:B14) totals the contents

