Multiple Choice
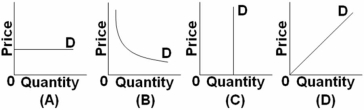 Refer to the above graphs.A price increase from $20 to $40 causes quantity demanded to decrease from 100 units to 50 units.Which graph best illustrates the price elasticity of demand for this good?
A) Graph A
B) Graph B
C) Graph C
D) Graph D
Correct Answer:
Verified
Related Questions

