People were surveyed in 3 different Asian countries about whether they are vegetarian or not. The graph below was created.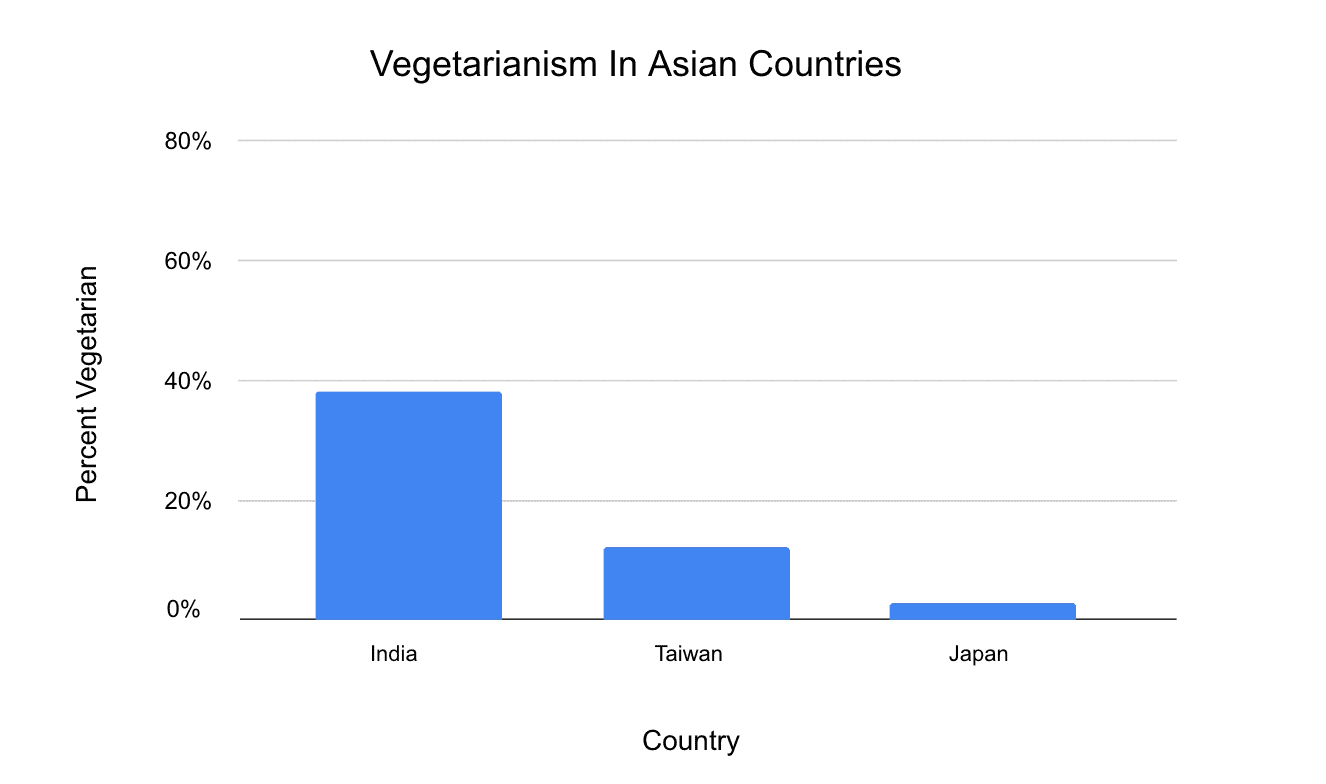 Which of the following statements is not necessarily true given only the information on the graph?
A) If you picked a Taiwanese person at random, there would be a less than 20% chance they would be vegetarian.
B) There are more meat eaters in all of the countries graphed than there are vegetarians.
C) The population of vegetarians is highest in India.
D) The percentage of vegetarians in Taiwan and Japan combined is lower than that of India.
Correct Answer:
Verified
Q199: Which of the following is equivalent to
Q200: Which of the following is equivalent to
Q201: Simplify the expression:
2 3⁄10 + 1 3⁄8
A)3
Q202: Simplify the expression:
5⁄6 • 5⁄2
A)2 1/6
B)2 1/12
C)2 1/8
D)2
Q203: Simplify the expression:
6 2⁄3 - 2 5⁄6
A)3
Q205: Simplify the expression:
3 • 1⁄2
A)1 1/2
B)3
Q206: Simplify the expression:
4 3⁄4 - 1 1⁄2
A)3
Q207: Simplify the expression:
9 11⁄21 + 3 5⁄7
A)5
Q208: Simplify the expression:
2 1⁄4 - 1 3⁄16
A)1
Q209: Simplify the expression:
4 • 6⁄7
A)3 3/7
B)3 5/6
C)3
Unlock this Answer For Free Now!
View this answer and more for free by performing one of the following actions

Scan the QR code to install the App and get 2 free unlocks

Unlock quizzes for free by uploading documents