A recreation center offers transportation for summer campers with a maximum distance of 15 miles. The cost for the first 10 miles is $.75 per mile and then $2.00 per mile after that.
Which of the following graphs most accurately shows the relationship between the cost of transportation and total mileage?
A) 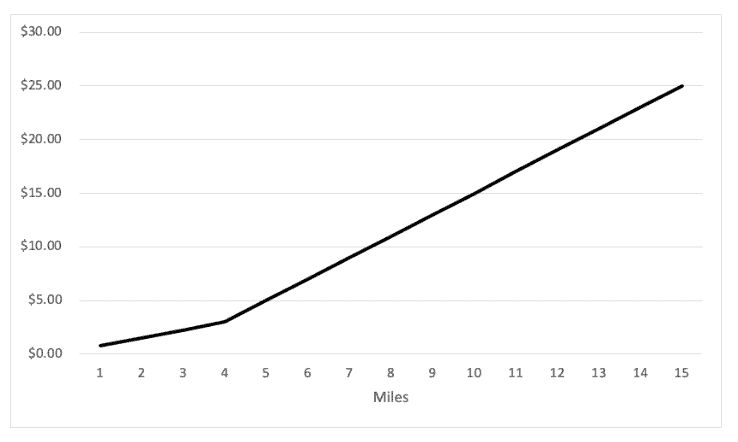
B) 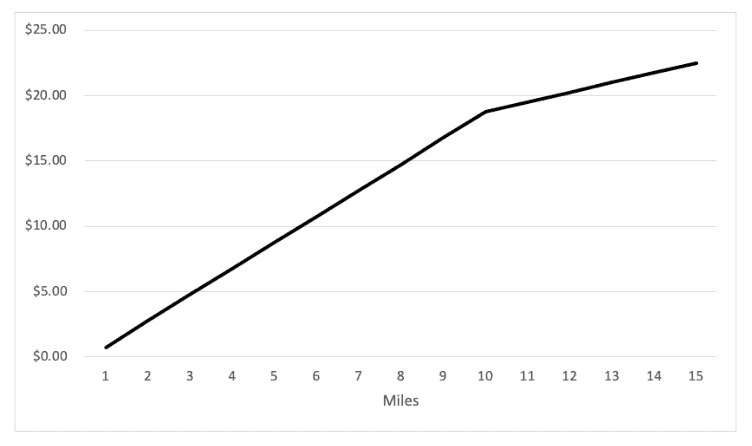
C) 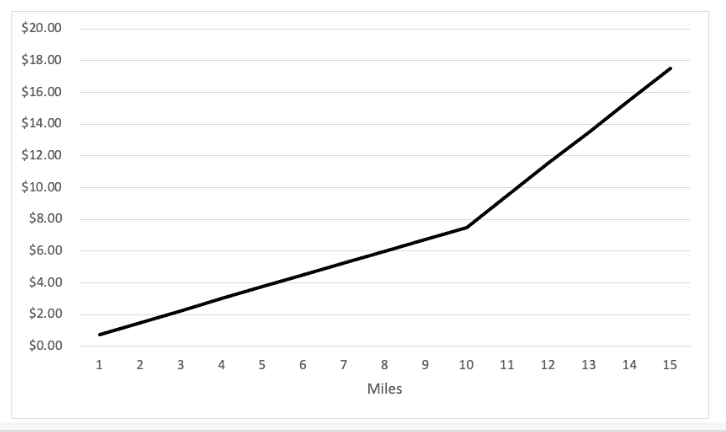
D) 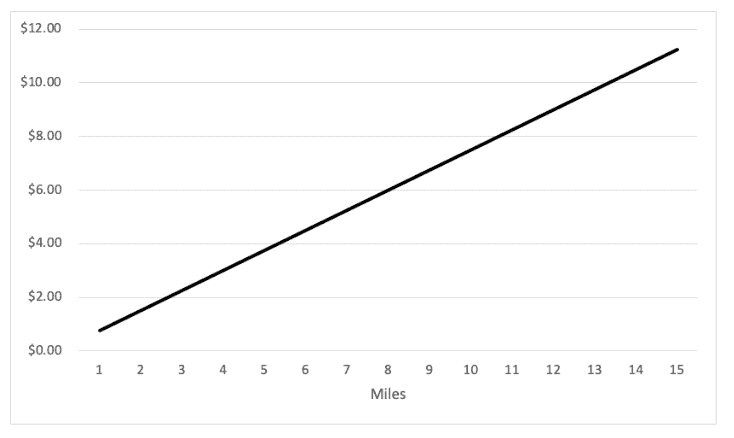
Correct Answer:
Verified
Q274: The sum of two numbers is 4.
Q275: Which of the following choices is true
Q276: For the following numbers, which is the
Q277: For the following numbers, which statement is
Q278: For the following numbers, which is the
Q280: The difference between two numbers is twice
Q281: A new phone costs $800. Margaret has
Q282: A grandmother makes 5 pies for a
Q283: Josephine makes jewelry for a small business.
Q284: For the following numbers, which is the
Unlock this Answer For Free Now!
View this answer and more for free by performing one of the following actions

Scan the QR code to install the App and get 2 free unlocks

Unlock quizzes for free by uploading documents