Two graphs illustrating the transport rate of solutes across the plasma membrane are shown on the slide below. 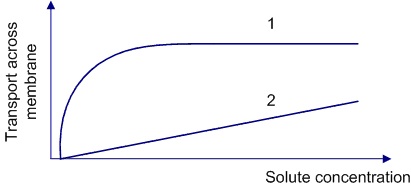 Which of the following best explains the difference in the shape of the curves?
A) Different amounts of membrane surface area for diffusion
B) Different degrees of membrane thickness
C) The 2 solutes have different molecular weights
D) The 2 solutes have different oil/water partition coefficients
E) The presence of a protein transporter
Correct Answer:
Verified
Q8: A 5-day-old term newborn is brought to
Q9: A 68-year-old man comes to the office
Q10: An 8-year-old boy is brought to the
Q11: An 11-year-old girl is evaluated for blurry
Q12: A 24-year-old woman comes to the office
Q14: A 54-year-old woman is evaluated for progressive
Q15: A 20-year-old man is evaluated in the
Q16: Nutrition researchers investigating the relationship between fructose
Q17: A 23-year-old apparently healthy man who recently
Q18: A research scientist studying the metabolic pathways
Unlock this Answer For Free Now!
View this answer and more for free by performing one of the following actions

Scan the QR code to install the App and get 2 free unlocks

Unlock quizzes for free by uploading documents