The graph below shows the yearly incidence of viral hepatitis per 100,000 population from 1982-2012 in the United States (US) . 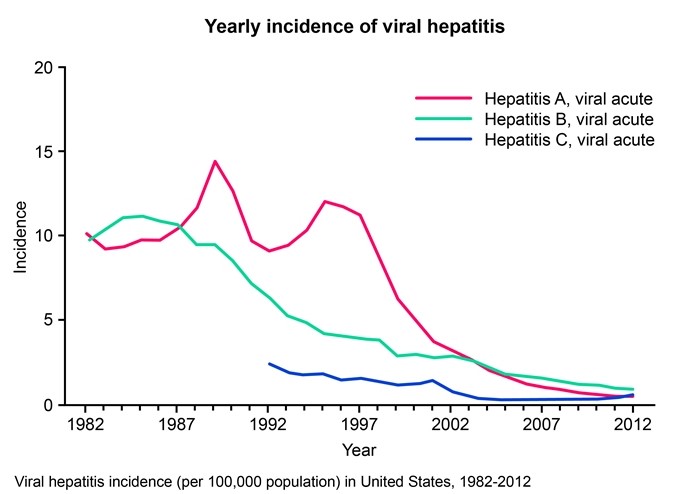 During this period, the total population in the US continued to increase, as shown in the table below:
 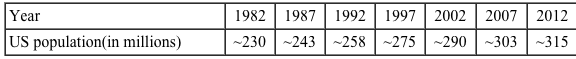 At any given time point, the number of individuals at risk for hepatitis infection is assumed to be equal to the total US population. Based on these data, which of the following is most likely to be true?
A) After 2006, hepatitis B prevalence surpassed hepatitis A and hepatitis C prevalence
B) In 1987, there were as many individuals with hepatitis A as with hepatitis B in the US
C) In 1989, there were more individuals with hepatitis A than with hepatitis B in the US
D) In 1997, there were more new cases of hepatitis A than of hepatitis B and C combined
E) The number of new cases of hepatitis A diagnosed in 1982 and 1998 were exactly the same
Correct Answer:
Verified
Q58: A study determines that the mean blood
Q59: A state's population for 2016 was estimated
Q60: A prospective cohort study was conducted to
Q61: A study is conducted to assess whether
Q62: A randomized controlled trial is conducted to
Q64: A clinical study examines the usefulness of
Q65: A prospective study evaluates the relationship between
Q66: A study investigating a new test for
Q67: A study is designed to evaluate the
Q68: Carbamoyl phosphate synthetase I deficiency is an
Unlock this Answer For Free Now!
View this answer and more for free by performing one of the following actions

Scan the QR code to install the App and get 2 free unlocks

Unlock quizzes for free by uploading documents