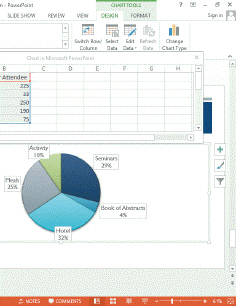
Referring to the accompanying illustration, to modify a chart s data, click the _____ button in the Data group on the CHART TOOLS DESIGN tab.
A) Edit Data
B) Select Data
C) Change Chart Type
D) Switch Row/Column
Correct Answer:
Verified
Q2: Colored borders and shading of cells indicate
Q4: Graphs show the relationship between variables along
Q7: To create a custom gradient within a
Q15: A(n) gradient is shading in which one
Q28: When a sound clip is added to
Q29: When working with a chart, if you
Q30: To create a SmartArt diagram, in the
Q32: To switch the order of the shapes
Q35: The intersection of a row and a
Q39: To change the shapes in the diagram,
Unlock this Answer For Free Now!
View this answer and more for free by performing one of the following actions

Scan the QR code to install the App and get 2 free unlocks

Unlock quizzes for free by uploading documents