During the years 1994 to 2007 seat belt use among front seat passengers ages 16 to 24 has increased. A linear model for the percentage of these passengers who use a seat belt is 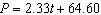 where P is percentage with a seat belt and t is years since 2000. The years before 2000 have a negative value for t. Use the model to predict the percentage of these passengers who used a seat belt in 2005.
A) 75%
B) 76.3%
C) 47.4%
Correct Answer:
Verified
Q13: The percentage of eighth grade students P
Q14: The percentage of eighth grade students P
Q15: During the years 1994 to 2007 seat
Q16: The percentage of eighth grade students P
Q17: The percentage of eighth grade students P
Q19: The percentage of eighth grade students P
Q20: During the years 1994 to 2007 seat
Q21: The percentage P of 6 to 11
Q22: Given the data set draw a scatterplot.
Q23: Given the data set draw a scatterplot.
Unlock this Answer For Free Now!
View this answer and more for free by performing one of the following actions

Scan the QR code to install the App and get 2 free unlocks

Unlock quizzes for free by uploading documents