During the years 1994 to 2007 seat belt use among front seat passengers ages 16 to 24 has increased. A linear model for the percentage of these passengers who use a seat belt is 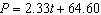 where P is percentage with a seat belt and t is years since 2000. The years before 2000 have a negative value for t. If you use the model to predict the percentage of these passengers who used a seat belt in 2006 which are you doing?
A) interpolation
B) extrapolation
Correct Answer:
Verified
Q5: Given the data set choose its scatterplot.
Q6: During the years 1994 to 2007 seat
Q7: Decide which line fits the data best.
A)
Q8: Given the data set choose its scatterplot.
Q9: The _ for a linear data set
Q11: Decide which line fits the data best.
A)
Q12: When you estimate an output value for
Q13: The percentage of eighth grade students P
Q14: The percentage of eighth grade students P
Q15: During the years 1994 to 2007 seat
Unlock this Answer For Free Now!
View this answer and more for free by performing one of the following actions

Scan the QR code to install the App and get 2 free unlocks

Unlock quizzes for free by uploading documents