Multiple Choice
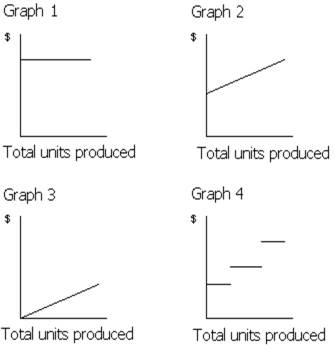 Figure 21-1
Which of the graphs in Figure 21-1 illustrates the behavior of a total fixed cost?
A) Graph 2
B) Graph 3
C) Graph 4
D) Graph 1
Correct Answer:
Verified
Related Questions
Q67: The three most common cost behavior classifications
Q70: Costs that vary in total in direct
Q71: Which of the following describes the behavior
Unlock this Answer For Free Now!
View this answer and more for free by performing one of the following actions

Scan the QR code to install the App and get 2 free unlocks

Unlock quizzes for free by uploading documents