 Figure 21-1
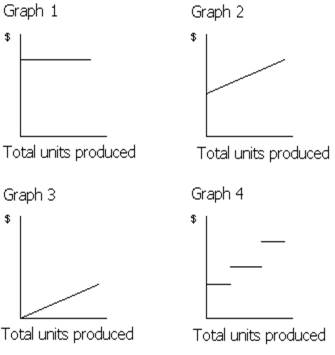
Which of the graphs in Figure 21-1 illustrates the behavior of a total variable cost?
A) Graph 2
B) Graph 3
C) Graph 4
D) Graph 1
Correct Answer:
Verified
Q62: Costs that remain constant in total dollar
Q63: Which of the following activity bases would
Q64: Which of the following is not an
Q65: A cost that has characteristics of both
Q66: Which of the following is an example
Q67: Cost behavior refers to the manner in
Q68: The graph of a variable cost when
Q70: Which of the following activity bases would
Q74: For purposes of analysis, mixed costs are
A)
Q80: Most operating decisions of management focus on
Unlock this Answer For Free Now!
View this answer and more for free by performing one of the following actions

Scan the QR code to install the App and get 2 free unlocks

Unlock quizzes for free by uploading documents