The temperature (in ° F) of a town is taken at the beginning of each hour throughout one day starting at 5 a.m. Let T be the function defined by T(x) = temperature of the town at time x . Which one of the following graphs represents this scenario?
A) 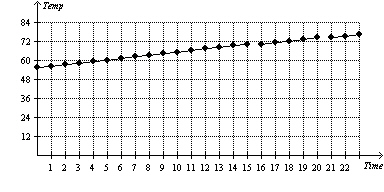
B) Not enough information
C) 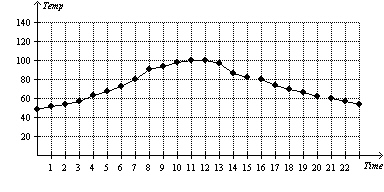
D) 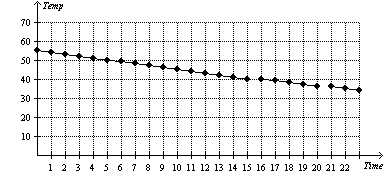
E) 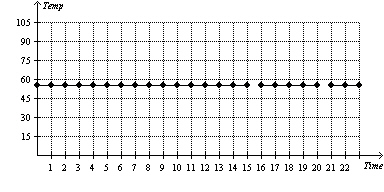
Correct Answer:
Verified
Q45: Consider the function f(x) = 4 x
Q46: Find the domain of Q47: A ball is thrown straight upward from Q48: Determine the domain and range of the Q49: Let f(x) = 3 x Q51: Use the following graph to create an Q52: Which one of the following best describes Q53: A membership to a local fitness club Q54: A population of rabbits was tracked over Q55: A membership to a local fitness club![]()

Unlock this Answer For Free Now!
View this answer and more for free by performing one of the following actions

Scan the QR code to install the App and get 2 free unlocks

Unlock quizzes for free by uploading documents