Given the distribution of grouped scores shown in the following table. 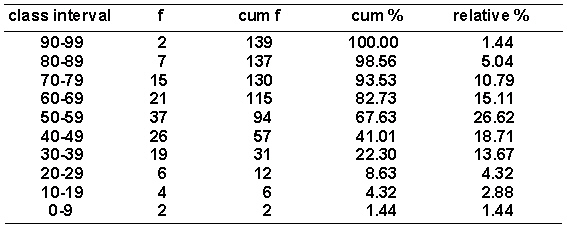 What is the value of i ?
A) 10
B) 9
C) 9.5
D) 10.5
Correct Answer:
Verified
Q48: The percentile point for a distribution of
Q49: A percentile point is defined as _.
A)
Q50: In constructing a frequency distribution of grouped
Q51: If the frequency of any score is
Q52: The percentile rank of a score is
Q54: In a frequency distribution of grouped scores,
Q55: A curve is negatively skewed when _.
A)
Q56: A histogram is like a bar graph
Q57: A frequency polygon results in a curve
Q58: Given the distribution of grouped scores shown
Unlock this Answer For Free Now!
View this answer and more for free by performing one of the following actions

Scan the QR code to install the App and get 2 free unlocks

Unlock quizzes for free by uploading documents