Consider the following stem-and-leaf diagram. 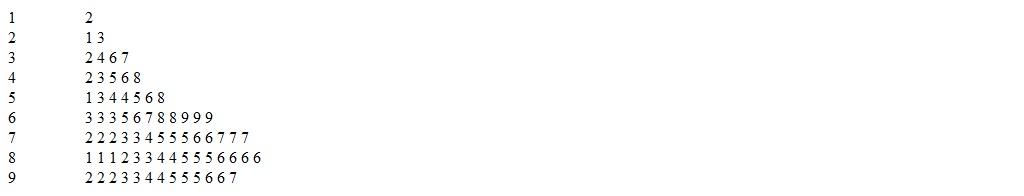 If the numbers in the left column are deciles, the median of the distribution falls in the range of _______.
A) 80 - 90
B) 60 - 69
C) 70 - 79
D) can't answer; need more information
Correct Answer:
Verified
Q54: In a frequency distribution of grouped scores,
Q55: A curve is negatively skewed when _.
A)
Q56: A histogram is like a bar graph
Q57: A frequency polygon results in a curve
Q58: Given the distribution of grouped scores shown
Q60: Given the distribution of grouped scores shown
Q61: When constructing the frequency distribution it is
Q62: A "U" shaped distribution is an example
Q63: A frequency distribution of grouped scores is
Q64: A frequency distribution presents the score values
Unlock this Answer For Free Now!
View this answer and more for free by performing one of the following actions

Scan the QR code to install the App and get 2 free unlocks

Unlock quizzes for free by uploading documents