For the frequency distribution shown in the following table, = 25. 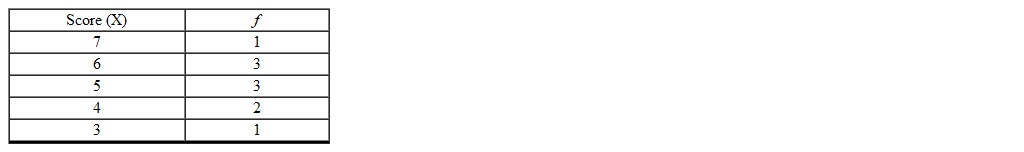
Correct Answer:
Verified
Q73: When constructing a distribution of grouped scores,
Q74: In a frequency distribution the more intervals
Q75: A cumulative frequency distribution indicates the number
Q76: A relative frequency distribution indicates the total
Q77: The vertical axis, i.e., the Y axis
Q79: Given a distribution of grouped scores, if
Q80: The percentile rank of a score is
Q81: Define histogram.
Q82: Define percentile rank.
Q83: Stem and leaf diagrams are like histograms,
Unlock this Answer For Free Now!
View this answer and more for free by performing one of the following actions

Scan the QR code to install the App and get 2 free unlocks

Unlock quizzes for free by uploading documents