Not Answered
Given the frequency distribution of grouped scores shown in the following table, determine P 50. 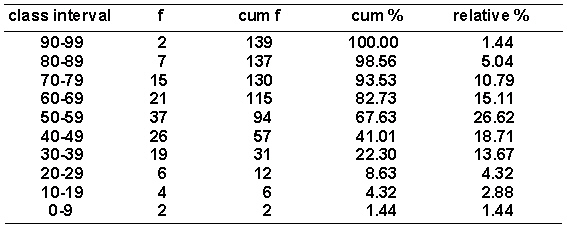
Correct Answer:
Verified
Related Questions
Q84: Define positively skewed curve.
Q85: Define cumulative percentage distribution.
Q86: Define percentile point.
Q87: Define negatively skewed curve.
Q88: Given the frequency distribution of grouped scores
Q90: The following scores were obtained on a
Q91: Give an example of a histogram. Be
Q92: Define skewed curve.
Q93: Define relative frequency distribution.
Q94: Define stem and leaf diagram.
Unlock this Answer For Free Now!
View this answer and more for free by performing one of the following actions

Scan the QR code to install the App and get 2 free unlocks

Unlock quizzes for free by uploading documents