Related Questions
Q96: Define bar graph.
Q97: Compare a histogram and a stem and
Q98: Define frequency polygon.
Q99: Compare and contrast a bar graph and
Q100: The lower limit in the lowest class
Q102: Sketch a cumulative frequency distribution for the
Q103: Assume the following are scores in a
Q104: Assume the following are weights of a
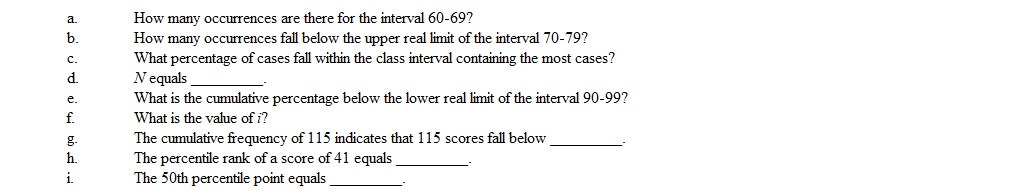
Q105: Consider the frequency distribution shown in the
Q106: What is wrong with the following frequency
Unlock this Answer For Free Now!
View this answer and more for free by performing one of the following actions

Scan the QR code to install the App and get 2 free unlocks

Unlock quizzes for free by uploading documents