The number of cases of flu seen by doctors at a county health clinic each week during a 10-week period is described by the quadratic function f ( x ) = -4 x 2 + 40 x (graphed in the illustration) . 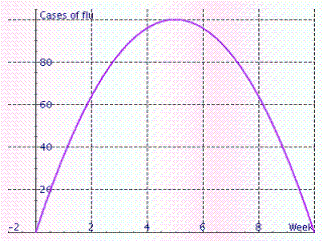 What point gives us information of the most cases of flu?
A) (5, 100)
B) (8, 100)
C) (10, 0)
D) (5, 0)
Correct Answer:
Verified
Q17: Complete the square and factor the
Q18: Use the square root method to
Q19: What is the first step to
Q20: Use the method of completing the
Q21: Use the discriminant to determine what
Q23: What coefficient indicates whether the graph
Q24: Solve the following quadratic equation using
Q25: Find the vertex of the graph
Q26: Solve the following quadratic equation using
Q27: What is the 4th step in
Unlock this Answer For Free Now!
View this answer and more for free by performing one of the following actions

Scan the QR code to install the App and get 2 free unlocks

Unlock quizzes for free by uploading documents