The purchasing power of the dollar (1967 = $1) is (to the nearest cent) : 1966, $1.03; 1968, $0.96; 1970, $0.86; 1972, $0.80; 1974, $0.68
Select the line graph that correctly represents the data.
A) 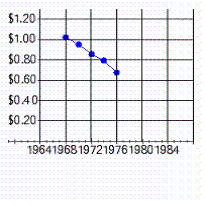
B) 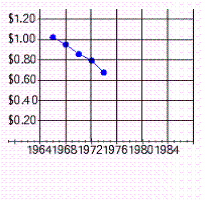
C) 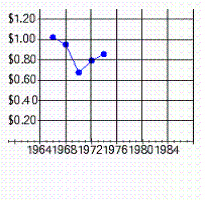
D) 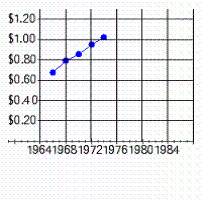
E) 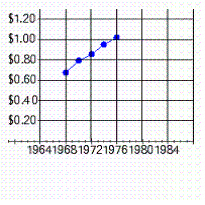
Correct Answer:
Verified
Q12: The gross profits for January at Tower
Q13: FIGURE 1. Q14: According to the Specialty Coffee Association, the Q15: The graph below shows percentages of children Q16: According to the Specialty Coffee Association, Q18: The amount of electricity used in a Q19: The wages of employees of a Q20: The heights of 20 students are as Q21: The following line graph shows the expenses Q22: 10,000 respondents were asked the following question.![]()
Unlock this Answer For Free Now!
View this answer and more for free by performing one of the following actions

Scan the QR code to install the App and get 2 free unlocks

Unlock quizzes for free by uploading documents