The following line graph shows the expenses for two salespeople of the Leadwell Pencil Company. 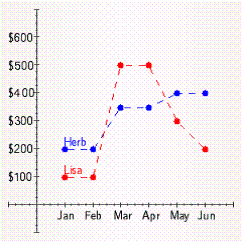 Which salesperson has more variability in his or her expenses?
Correct Answer:
Verified
Q31: FIGURE 1. Q32: The gross profits for January at Tower Q33: FIGURE 1. Q34: The wages of employees of a Q35: The graph below shows percentages of children Q37: According to the Specialty Coffee Association, the Q38: The amount of electricity used in a Q39: The gross profits for January at Tower Q40: The gross profits for January at Tower Q41: The graph below shows percentages of children![]()
![]()
Unlock this Answer For Free Now!
View this answer and more for free by performing one of the following actions

Scan the QR code to install the App and get 2 free unlocks

Unlock quizzes for free by uploading documents