A study assesses the length of stay in the intensive care unit after common surgical procedures. The following graph is obtained by plotting the number of admissions against length of stay (in days) . 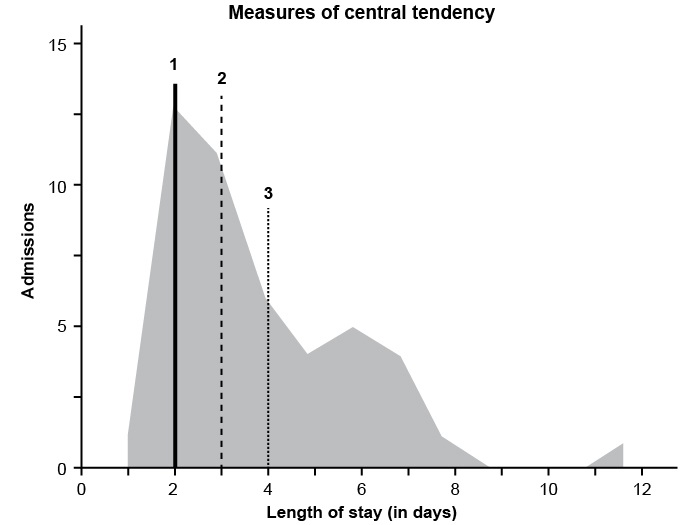 Which of the following corresponds to the measures of central tendency on the graph?
A) Line 1: Mean; Line 2: Median; Line 3: Mode
B) Line 1: Median; Line 2: Mean; Line 3: Mode
C) Line 1: Median; Line 2: Mode; Line 3: Mean
D) Line 1: Mode; Line 2: Mean; Line 3: Median
E) Line 1: Mode; Line 2: Median; Line 3: Mean
Correct Answer:
Verified
Q62: A randomized, double-blinded clinical trial was conducted
Q63: A 54-year-old man comes to the office
Q64: A team of neurologists and psychologists researching
Q65: A 62-year-old man with a history of
Q66: The drug advertisement suggests that BoXeva should
Q68: The following advertisement is focused on LDL
Q69: The drug advertisement suggests the addition of
Q70: A group of researchers is designing a
Q71: Two groups of investigators are interested in
Q72: A 65-year-old man comes to the clinic
Unlock this Answer For Free Now!
View this answer and more for free by performing one of the following actions

Scan the QR code to install the App and get 2 free unlocks

Unlock quizzes for free by uploading documents