Which statement is NOT correct about the Fitted Line Plot shown here? 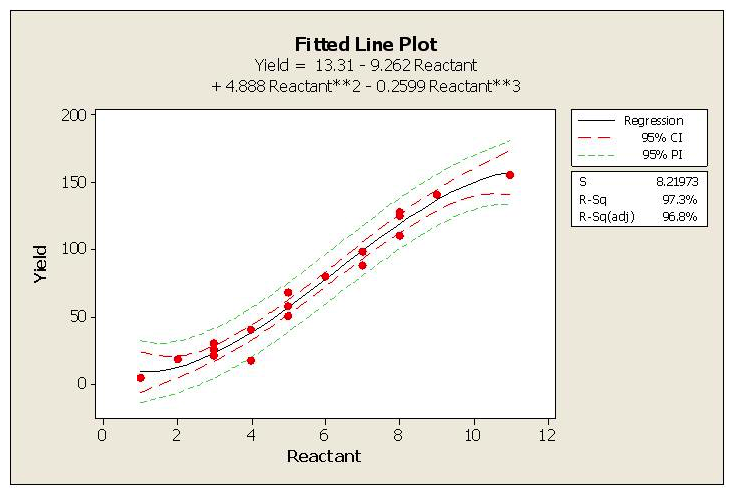
A) The independent variable is the reactant
B) If the reactant was 6 units, with 95 % confidence we would expect a minimum yield of 100 units
C) With at least 95% confidence, we can expect less than 10 units of Yield when the reactant is at a value of 1
D) A reactant value between 2 and 4 units yields around 20 to 40
E) When the reactant increases, the expected yield would increase
Correct Answer:
Verified
Q1: Which statement(s) are incorrect for the Regression
Q2: Fractional Factorial designs are used to reduce
Q3: A Belt working in a supply chain
Q4: Which of these might contribute to similar
Q6: When a Belt decides to use written
Q7: A Full Factorial experiment using a 3
Q8: When a Belt conducts a Linear Correlation
Q9: A Factorial Experiment based on a Level
Q10: When doing Hypothesis Testing on Non-normal data
Q11: A valid mathematical Regression represents all of
Unlock this Answer For Free Now!
View this answer and more for free by performing one of the following actions

Scan the QR code to install the App and get 2 free unlocks

Unlock quizzes for free by uploading documents