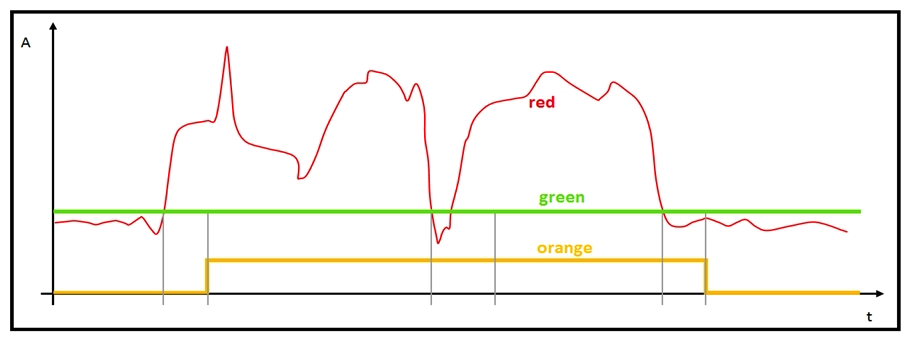
 Refer to the exhibit. The red line represents the energy consumption of an industrial machine. Which two statements about the graphs are true? (Choose two.)
A) The orange graph is expected to drop to zero for a brief period around the midpoint on the x axis. The orange graph is expected to drop to zero for a brief period around the midpoint on the x axis.
B) The red graph contains the raw data points.
C) The green graph is the mean value of the data points.
D) The green graph does not give us any valuable information.
E) The orange graph has three values on the y -axis. The orange graph has three values on the y -axis.
Correct Answer:
Verified
Q31: Q32: As part of an IoT project, an Q33: Q34: Q35: Which lightweight protocol is used to send Q36: What are two functionalities of edge data Q37: An IoT engineer is working on a Q38: Which two security approaches help build a Unlock this Answer For Free Now! View this answer and more for free by performing one of the following actions Scan the QR code to install the App and get 2 free unlocks Unlock quizzes for free by uploading documents![]()
![]()
![]()

