You have some data, which is shown in the graphic below. The two dimensions are X and Y, and the shade of each dot represents what class it is. You want to classify this data accurately using a linear algorithm. To do this you need to add a synthetic feature. What should the value of that feature be? 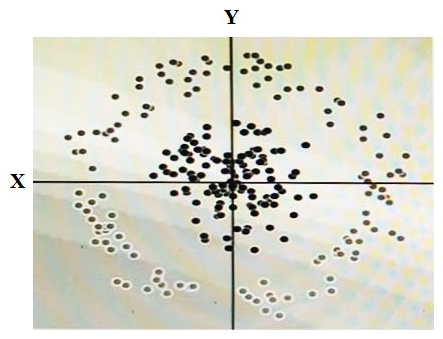
A) X^2+Y^2
B) X^2
C) Y^2
D) cos(X)
Correct Answer:
Verified
Q21: Your company is loading comma-separated values (CSV)
Q22: You are designing the database schema for
Q23: An organization maintains a Google BigQuery dataset
Q24: Your company receives both batch- and stream-based
Q25: You are deploying a new storage system
Q27: An online retailer has built their current
Q28: Your company produces 20,000 files every hour.
Q29: Your analytics team wants to build a
Q30: You have enabled the free integration between
Q31: You are developing an application that uses
Unlock this Answer For Free Now!
View this answer and more for free by performing one of the following actions

Scan the QR code to install the App and get 2 free unlocks

Unlock quizzes for free by uploading documents