An analyst generates the following color-coded table shown in the exhibit to help explain the risk of potential incidents in the company. The vertical axis indicates the likelihood or an incident, while the horizontal axis indicates the impact. 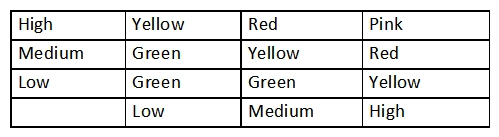 Which of the following is this table an example of?
A) Internal threat assessment
B) Privacy impact assessment
C) Qualitative risk assessment
D) Supply chain assessment
Correct Answer:
Verified
Q1053: A company is executing a strategy to
Q1054: A security analyst monitors the syslog server
Q1055: A security specialist is notified about a
Q1056: Ann, a customer, is reporting that several
Q1057: A security analyst conducts a manual scan
Q1059: An organization has an account management policy
Q1060: Which of the following implements a stream
Q1061: The CSIRT is reviewing the lessons learned
Q1062: Which of the following describes the ability
Q1063: A company is deploying a wireless network.
Unlock this Answer For Free Now!
View this answer and more for free by performing one of the following actions

Scan the QR code to install the App and get 2 free unlocks

Unlock quizzes for free by uploading documents