In a drug trial, one patient receives an injection containing inactivated antigen A and another patient receives a saline injection. The immune system can mount a response against inactive antigen A. If each patient was exposed to antigen A twice after receiving the initial injection, which of the following graphs shows the expected changes in the levels of serum antibodies against antigen A across time?
A) 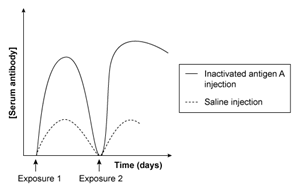
B) 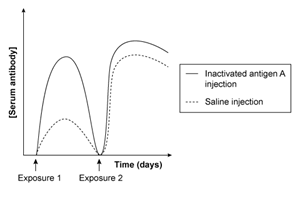
C) 
D) 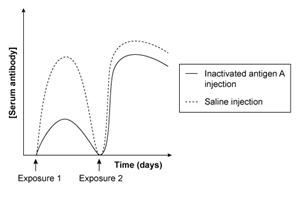
Correct Answer:
Verified
Q309: The sequence below represents a mature mRNA
Q310: In humans, meiosis and mitosis are most
Q311: Passage
Proteins known as cancer/testis antigens (CTAs) are
Q312: Passage
Proteins known as cancer/testis antigens (CTAs) are
Q313: Passage
Proteins known as cancer/testis antigens (CTAs) are
Q314: Passage
Proteins known as cancer/testis antigens (CTAs) are
Q315: One function of the bulbourethral glands is
Q316: Passage
The heart is a muscular organ comprising
Q317: Following intron splicing in the nucleus, a
Q319: Autonomous retrotransposons are segments of DNA that
Unlock this Answer For Free Now!
View this answer and more for free by performing one of the following actions

Scan the QR code to install the App and get 2 free unlocks

Unlock quizzes for free by uploading documents