Solved

Passage In the Event of End-Stage Heart Failure, a Left Ventricular

Question 69

Multiple Choice

Passage
In the event of end-stage heart failure, a left ventricular assist device (LVAD) can be used as a heart transplant bridge to keep a patient alive.  The first iterations of LVADs were pulsatile and mimicked the physiological pumping action of the heart (Figure 1) .
Passage In the event of end-stage heart failure, a left ventricular assist device (LVAD)  can be used as a heart transplant bridge to keep a patient alive.  The first iterations of LVADs were pulsatile and mimicked the physiological pumping action of the heart (Figure 1) .    <strong>Figure 1</strong>  A pulsatile-flow LVAD schematicA pulsatile-flow LVAD assists ventricular systole by mechanically pumping blood from a weakened left ventricle into the aorta through a pair of one-way valves.  The pressure differential ΔP generated by the pump is related to cardiac output (CO)  and vascular resistance (VR) :ΔP = CO × VR<strong>Equation 1</strong>The efficiency and performance of the heart (or LVAD)  can be determined by the patient's cardiac pressure-volume (PV)  loop.  A cardiac PV loop plots the pressure and volume of the blood in the left ventricle throughout a single cardiac cycle (Figure 2) .    <strong>Figure 2</strong>  Cardiac PV Loop of a pulsatile-flow LVADBlood pressure is often represented by only two numbers:  arterial systolic and diastolic pressures.  A more detailed representation of blood pressures is shown in a blood pressure profile, which graphs the blood pressure throughout the length of the different vessel groups (Figure 3) .  Multiple pressure fluctuations are shown within a vessel because the pressure is traced across multiple cardiac cycles.    <strong>Figure 3</strong>  Blood pressure profile of the different vessels -If the radius of the outflow tube is 1 cm and the LVAD pump generates a pressure of 45 mm Hg, what is the velocity of blood through the outflow tube if peripheral resistance is 1 mm Hg⋅s⋅mL<sup>−1</sup>? A) 45/π cm/s B) 45/π cm<sup>3</sup>/s C) 45 cm/s D) 45 cm<sup>3</sup>/s 
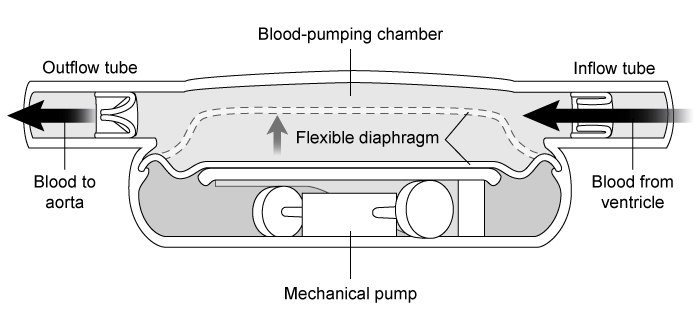
Figure 1  A pulsatile-flow LVAD schematicA pulsatile-flow LVAD assists ventricular systole by mechanically pumping blood from a weakened left ventricle into the aorta through a pair of one-way valves.  The pressure differential ΔP generated by the pump is related to cardiac output (CO) and vascular resistance (VR) :ΔP = CO × VREquation 1The efficiency and performance of the heart (or LVAD) can be determined by the patient's cardiac pressure-volume (PV) loop.  A cardiac PV loop plots the pressure and volume of the blood in the left ventricle throughout a single cardiac cycle (Figure 2) .
Passage In the event of end-stage heart failure, a left ventricular assist device (LVAD)  can be used as a heart transplant bridge to keep a patient alive.  The first iterations of LVADs were pulsatile and mimicked the physiological pumping action of the heart (Figure 1) .    <strong>Figure 1</strong>  A pulsatile-flow LVAD schematicA pulsatile-flow LVAD assists ventricular systole by mechanically pumping blood from a weakened left ventricle into the aorta through a pair of one-way valves.  The pressure differential ΔP generated by the pump is related to cardiac output (CO)  and vascular resistance (VR) :ΔP = CO × VR<strong>Equation 1</strong>The efficiency and performance of the heart (or LVAD)  can be determined by the patient's cardiac pressure-volume (PV)  loop.  A cardiac PV loop plots the pressure and volume of the blood in the left ventricle throughout a single cardiac cycle (Figure 2) .    <strong>Figure 2</strong>  Cardiac PV Loop of a pulsatile-flow LVADBlood pressure is often represented by only two numbers:  arterial systolic and diastolic pressures.  A more detailed representation of blood pressures is shown in a blood pressure profile, which graphs the blood pressure throughout the length of the different vessel groups (Figure 3) .  Multiple pressure fluctuations are shown within a vessel because the pressure is traced across multiple cardiac cycles.    <strong>Figure 3</strong>  Blood pressure profile of the different vessels -If the radius of the outflow tube is 1 cm and the LVAD pump generates a pressure of 45 mm Hg, what is the velocity of blood through the outflow tube if peripheral resistance is 1 mm Hg⋅s⋅mL<sup>−1</sup>? A) 45/π cm/s B) 45/π cm<sup>3</sup>/s C) 45 cm/s D) 45 cm<sup>3</sup>/s 
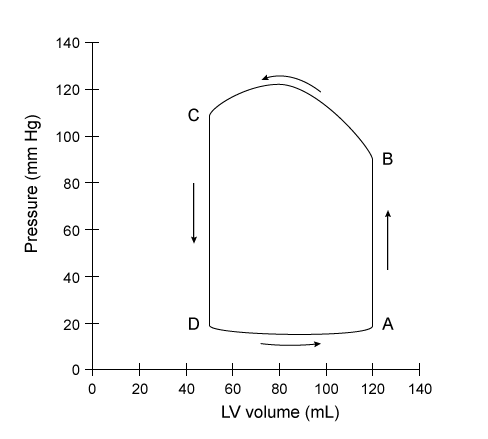
Figure 2  Cardiac PV Loop of a pulsatile-flow LVADBlood pressure is often represented by only two numbers:  arterial systolic and diastolic pressures.  A more detailed representation of blood pressures is shown in a blood pressure profile, which graphs the blood pressure throughout the length of the different vessel groups (Figure 3) .  Multiple pressure fluctuations are shown within a vessel because the pressure is traced across multiple cardiac cycles.
Passage In the event of end-stage heart failure, a left ventricular assist device (LVAD)  can be used as a heart transplant bridge to keep a patient alive.  The first iterations of LVADs were pulsatile and mimicked the physiological pumping action of the heart (Figure 1) .    <strong>Figure 1</strong>  A pulsatile-flow LVAD schematicA pulsatile-flow LVAD assists ventricular systole by mechanically pumping blood from a weakened left ventricle into the aorta through a pair of one-way valves.  The pressure differential ΔP generated by the pump is related to cardiac output (CO)  and vascular resistance (VR) :ΔP = CO × VR<strong>Equation 1</strong>The efficiency and performance of the heart (or LVAD)  can be determined by the patient's cardiac pressure-volume (PV)  loop.  A cardiac PV loop plots the pressure and volume of the blood in the left ventricle throughout a single cardiac cycle (Figure 2) .    <strong>Figure 2</strong>  Cardiac PV Loop of a pulsatile-flow LVADBlood pressure is often represented by only two numbers:  arterial systolic and diastolic pressures.  A more detailed representation of blood pressures is shown in a blood pressure profile, which graphs the blood pressure throughout the length of the different vessel groups (Figure 3) .  Multiple pressure fluctuations are shown within a vessel because the pressure is traced across multiple cardiac cycles.    <strong>Figure 3</strong>  Blood pressure profile of the different vessels -If the radius of the outflow tube is 1 cm and the LVAD pump generates a pressure of 45 mm Hg, what is the velocity of blood through the outflow tube if peripheral resistance is 1 mm Hg⋅s⋅mL<sup>−1</sup>? A) 45/π cm/s B) 45/π cm<sup>3</sup>/s C) 45 cm/s D) 45 cm<sup>3</sup>/s 
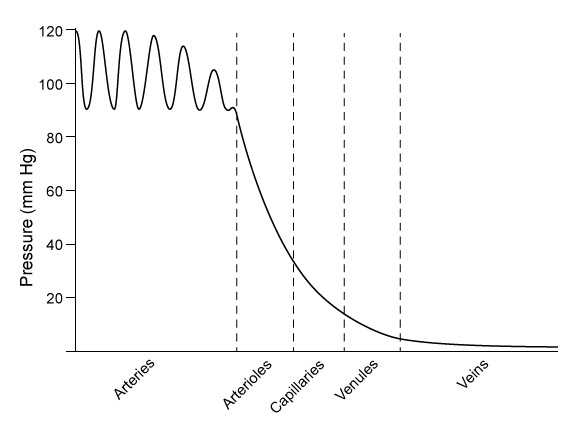
Figure 3  Blood pressure profile of the different vessels
-If the radius of the outflow tube is 1 cm and the LVAD pump generates a pressure of 45 mm Hg, what is the velocity of blood through the outflow tube if peripheral resistance is 1 mm Hg⋅s⋅mL−1?


A) 45/π cm/s
B) 45/π cm3/s
C) 45 cm/s
D) 45 cm3/s

Correct Answer:

verifed

Verified

Unlock this answer now
Get Access to more Verified Answers free of charge

Related Questions

Unlock this Answer For Free Now!

View this answer and more for free by performing one of the following actions

qr-code

Scan the QR code to install the App and get 2 free unlocks

upload documents

Unlock quizzes for free by uploading documents