Figure 2-4
Graph (a)
Graph (b)
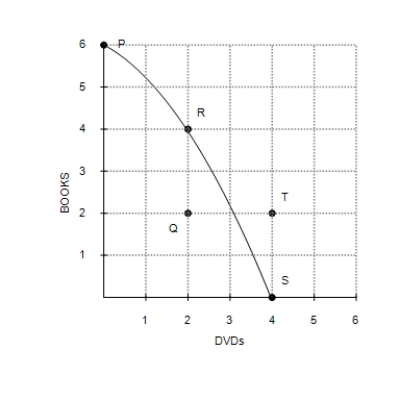
-Refer to Figure 2-4, Graph (a) . Production at point Q is
A) possible and efficient.
B) possible but inefficient.
C) impossible but efficient.
D) impossible and inefficient.
Correct Answer:
Verified
Q220: The inner loop of the circular-flow diagram
Q221: Suppose a nation is currently producing at
Q222: Where can an economy not produce?
A)Inside its
Q223: Figure 2-2 Q224: The production possibilities frontier provides an illustration Q226: Figure 2-3 Q227: Figure 2-1 Q228: The bowed-outward shape of the production possibilities Q229: Table 2-1 Q230: Table 2-1 Unlock this Answer For Free Now! View this answer and more for free by performing one of the following actions Scan the QR code to install the App and get 2 free unlocks Unlock quizzes for free by uploading documents
![]()
![]()
![]()

