Figure 2-7
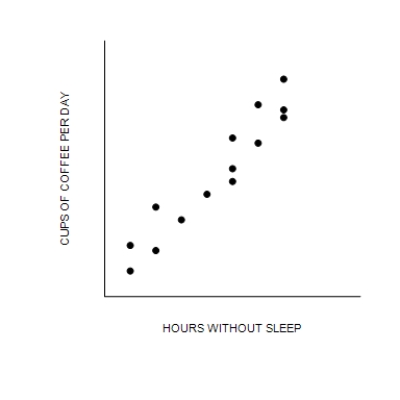
-Refer to Figure 2-7. The graph shown is known as a
A) time-series graph.
B) bar graph.
C) scatterplot.
D) pie chart.
Correct Answer:
Verified
Q261: When two variables move in the same
Q262: From which of the following agencies does
Q263: In the ordered pair (19, 25), 25
Q264: The x-coordinate of an ordered pair specifies
Q265: When a relevant variable that is not
Q267: When two variables have a negative correlation,
A)if
Q268: Figure 2-8 Q269: Sometimes economists disagree because their scientific judgments Q270: The president of the United States receives Q271: Figure 2-7
![]()
![]()
Unlock this Answer For Free Now!
View this answer and more for free by performing one of the following actions

Scan the QR code to install the App and get 2 free unlocks

Unlock quizzes for free by uploading documents