Figure 2-9
Commuter Rail Passengers by Frequency of Service
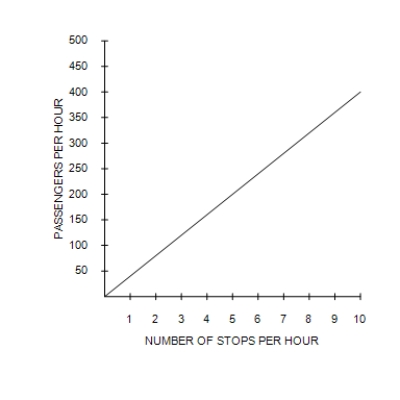
-Refer to Figure 2-9. Which of the following conclusions should not be drawn from observing this graph?
A) There is a positive correlation between the frequency of service and the number of passengers.
B) When there are five stops per hour, there are approximately 200 passengers.
C) More stops per hour is associated with more passengers per hour.
D) No other factors besides the frequency of service affect the number of passengers.
Correct Answer:
Verified
Q274: Economists at the Department of Justice
A)track the
Q275: Kiara wants to create a graph containing
Q276: Analysis of data on workers and those
Q277: A survey of professional economists revealed that
Q278: Economists sometimes give conflicting advice because
A)graduate students
Q279: The point where both x and y
Q280: Suppose the price level is measured along
Q281: In the early 19th century, the Russian
Q282: The slope of a line that
Q284: Which of the following is correct?
A)The slope
Unlock this Answer For Free Now!
View this answer and more for free by performing one of the following actions

Scan the QR code to install the App and get 2 free unlocks

Unlock quizzes for free by uploading documents