Refer to the figure.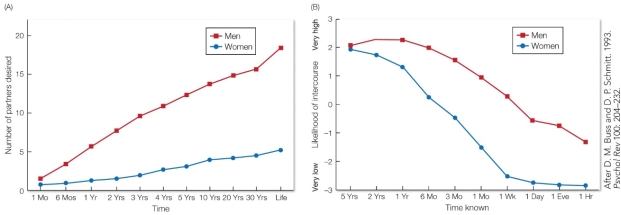 Part A shows the number of sexual partners men and women report wanting over different periods of time, and Part B shows men's and women's estimates of the likelihood of agreeing to sexual intercourse with an attractive partner they have known for varying lengths of time. Based on this study, we can conclude that men and women
A) differ in their mate preferences, leading to sexual conflict.
B) differ in their mate preferences, leading to reproductive conflict.
C) differ in their mate preferences in the short-term but align in the long-term.
D) align in their mate preferences overall.
Correct Answer:
Verified
Q4: In a study on mate choice, men
Q5: In a study on mate choice, men
Q6: Which of the following findings supports the
Q7: The FOXP2 gene
A) is under strong natural
Q8: Refer to the figure. Q10: Using the comparative approach, researchers have found Q11: Which statement most accurately describes the neurophysiology Q12: Isabel Scott and colleagues conducted a study Q13: Refer to the figure. Q14: Refer to the figure below. Unlock this Answer For Free Now! View this answer and more for free by performing one of the following actions Scan the QR code to install the App and get 2 free unlocks Unlock quizzes for free by uploading documents![]()
![]()
![]()

