Multiple Choice
Refer to the figure shown.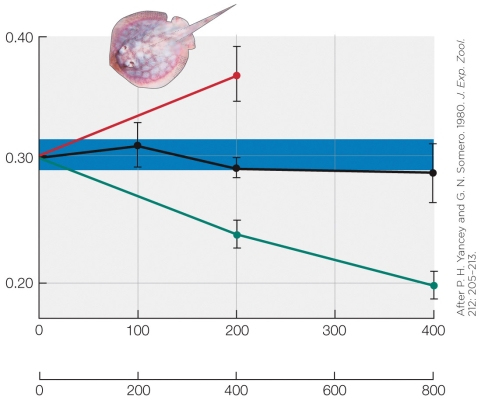 The shaded area on the graph represents the
A) rate of enzyme catalysis.
B) normal enzyme substrate affinity.
C) normal range of osmolarity.
D) optimal metabolic rate.
Correct Answer:
Verified
Related Questions
Q56: If cells are submerged in hypertonic solution
Q57: If the osmotic U/P ratio is greater
Q58: If the osmotic U/P ratio is less
Q59: Which collection of solutes, when dissolved in
Q60: In terms of osmotic pressure exerted, which
Unlock this Answer For Free Now!
View this answer and more for free by performing one of the following actions

Scan the QR code to install the App and get 2 free unlocks

Unlock quizzes for free by uploading documents