Refer to the figure shown.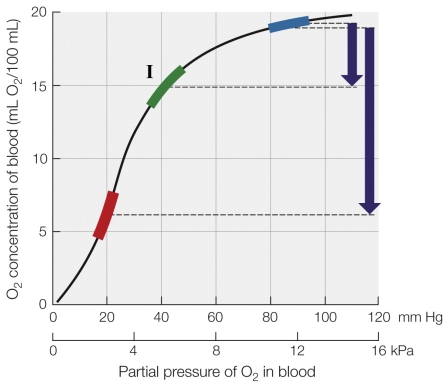 The curve on the graph
A) represents oxygen delivery by human blood at rest and during vigorous exercise.
B) is a vertebrate oxygen dissociation curve.
C) is a mammalian oxygen dissociation curve.
D) represents the increase in oxygen concentration as blood travels to the lungs.
Correct Answer:
Verified
Q21: A respiratory pigment that requires a relatively
Q22: The effect of acid in reducing the
Q23: Which statement is not directly related to
Q24: The affinity of hemoglobin for O2 increases
Q25: The venous blood displays a reduced O2
Q27: Refer to the figure shown. Q28: Refer to the figure shown. Q29: The venous O2 partial pressure below which Q30: Refer to the figure shown. Q31: Refer to the figure shown. Unlock this Answer For Free Now! View this answer and more for free by performing one of the following actions Scan the QR code to install the App and get 2 free unlocks Unlock quizzes for free by uploading documents![]()
![]()
![]()
![]()

